Downtime
The Downtime in RigPulse is designed to track and document periods when rig operations are halted due to events like equipment failure or waiting on weather. This is crucial for financial accountability between the operator and contractor, and is crucial when the downtime affects the critical path.
How it looks
Downtime events dashboard
The Downtime Events Dashboard is located on the right side of the report dashboard and displays all downtime events for the selected month.
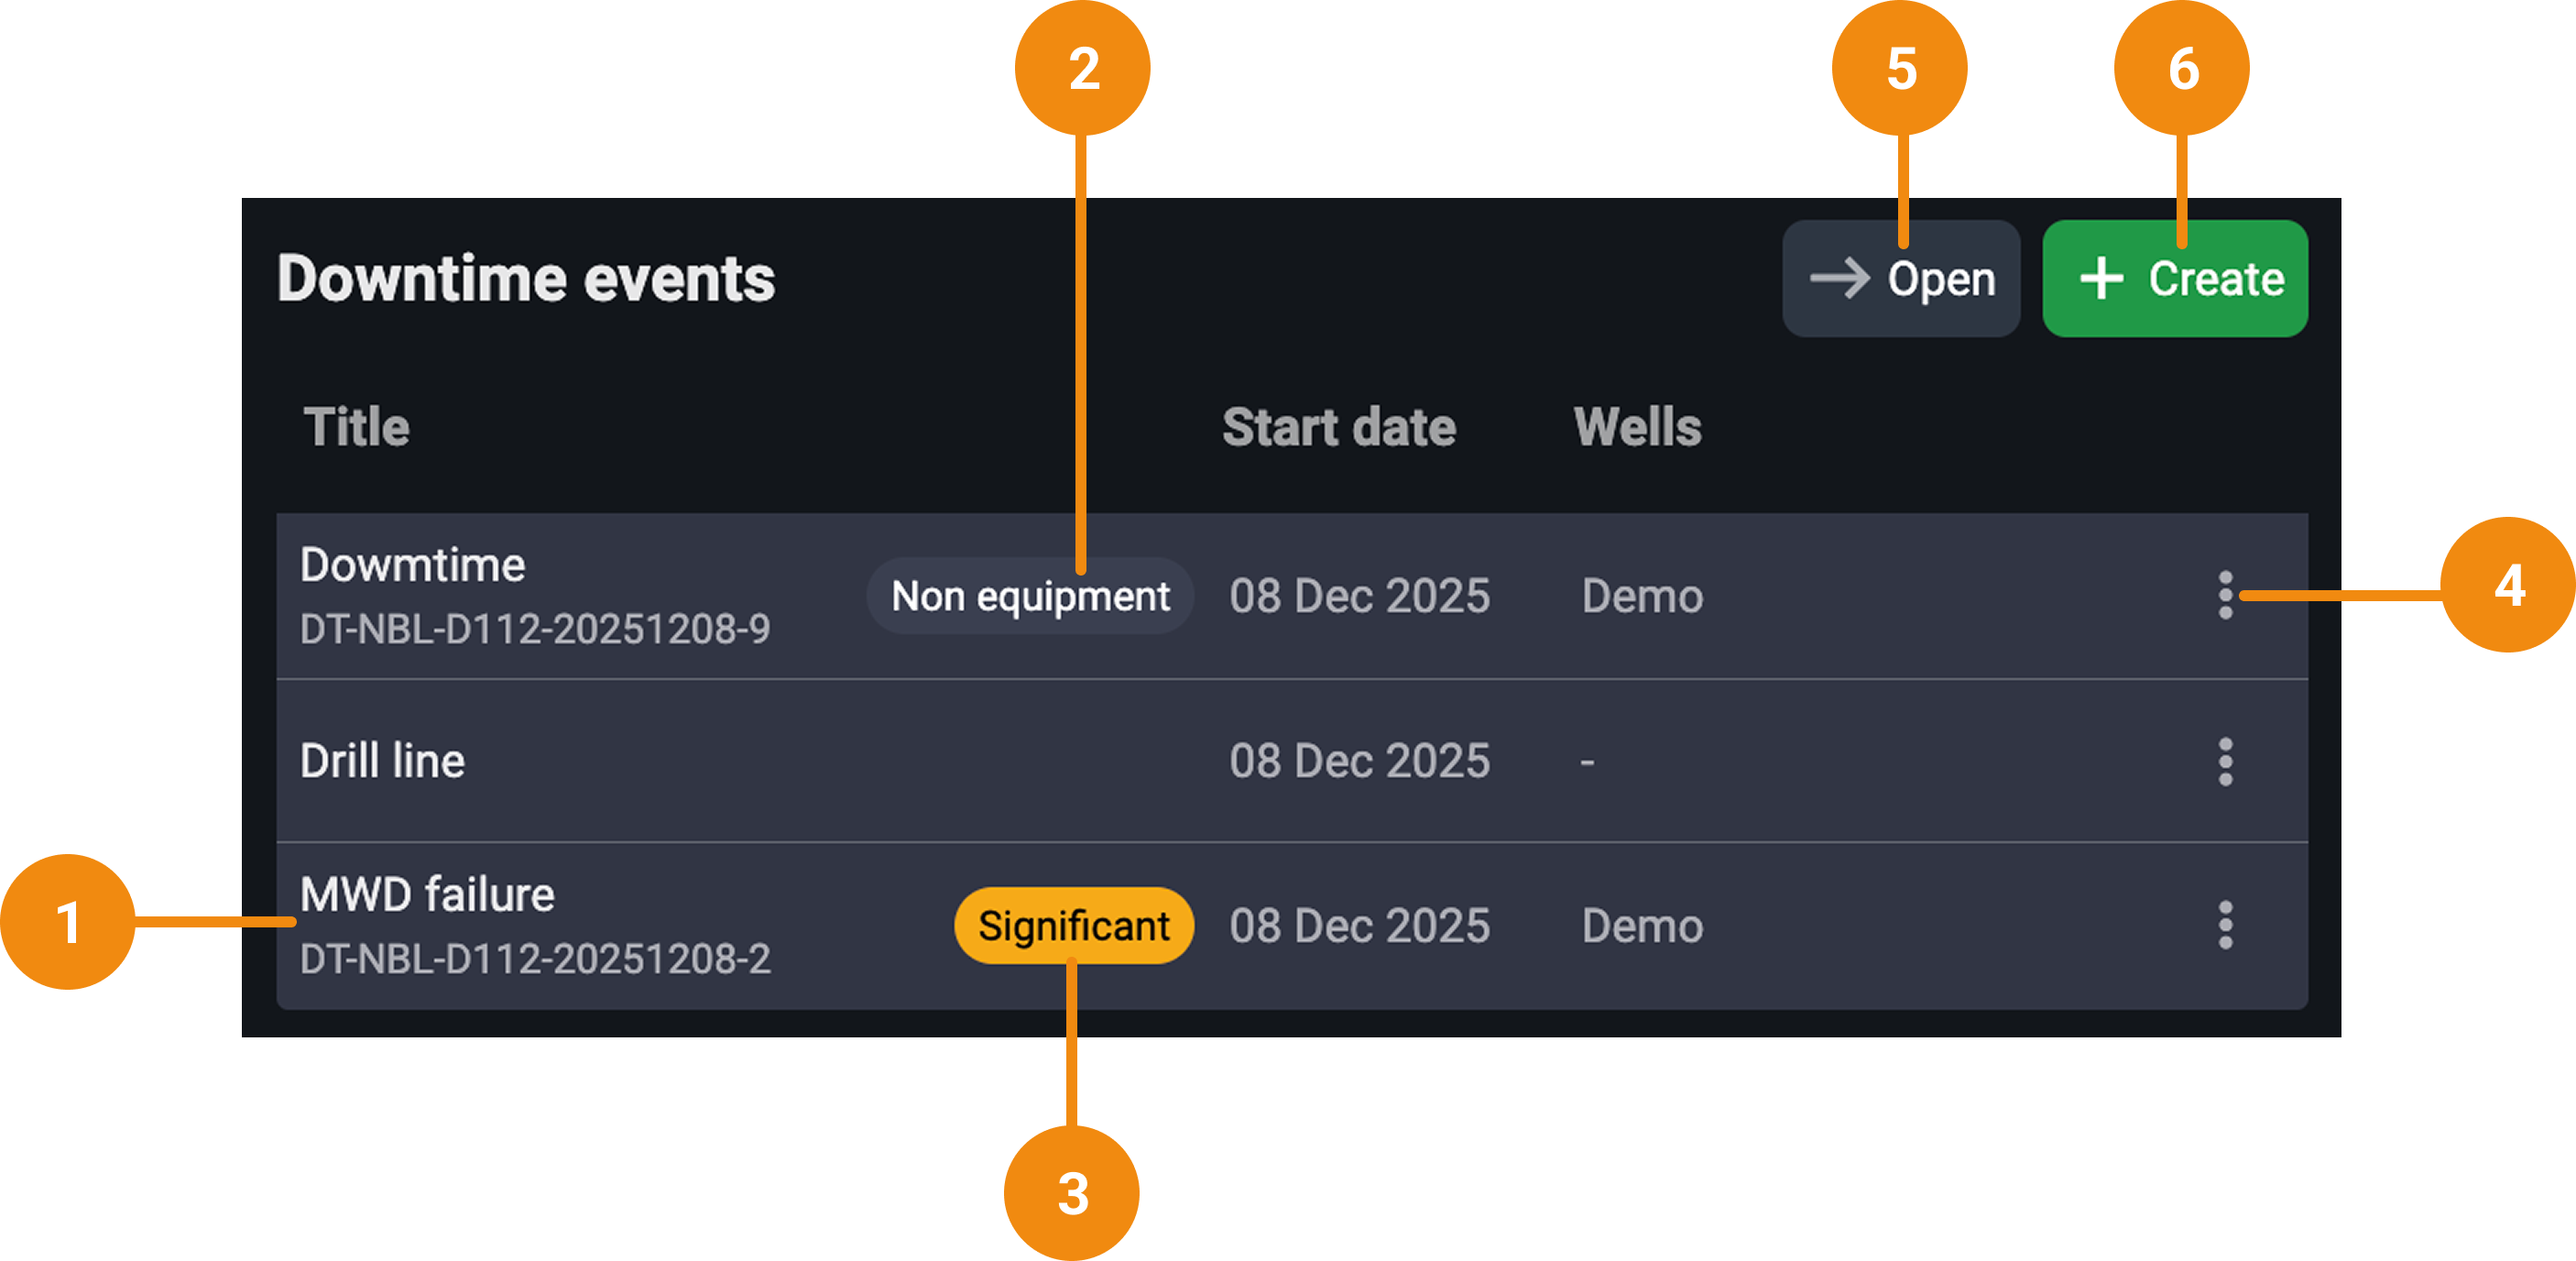
Event lines: Each event appears as a line showing its title, downtime event ID (if linked), creation date, associated well (if linked), and a tag (if applicable).
Non equipment related tag: A "Non equipment" tag appears when the "Non equipment related downtime" toggle is selected during creation, simplifying the form.
Significant chip: A chip labeled "Significant" appears on events that have downtime equal to or greater than 6 hours.
More menu: Located at the end of each event line; lets users download or delete an event (if it has no linked operational lines).
 Open button: This button displays all event details for the selected month in expanded view.
 Create Button: A green button at the top-right of the dashboard that allows users to initiate a new downtime event.
Downtime
The Downtime opens after clicking an event line or creating a new one, and it displays all editable and reference fields for that downtime report.
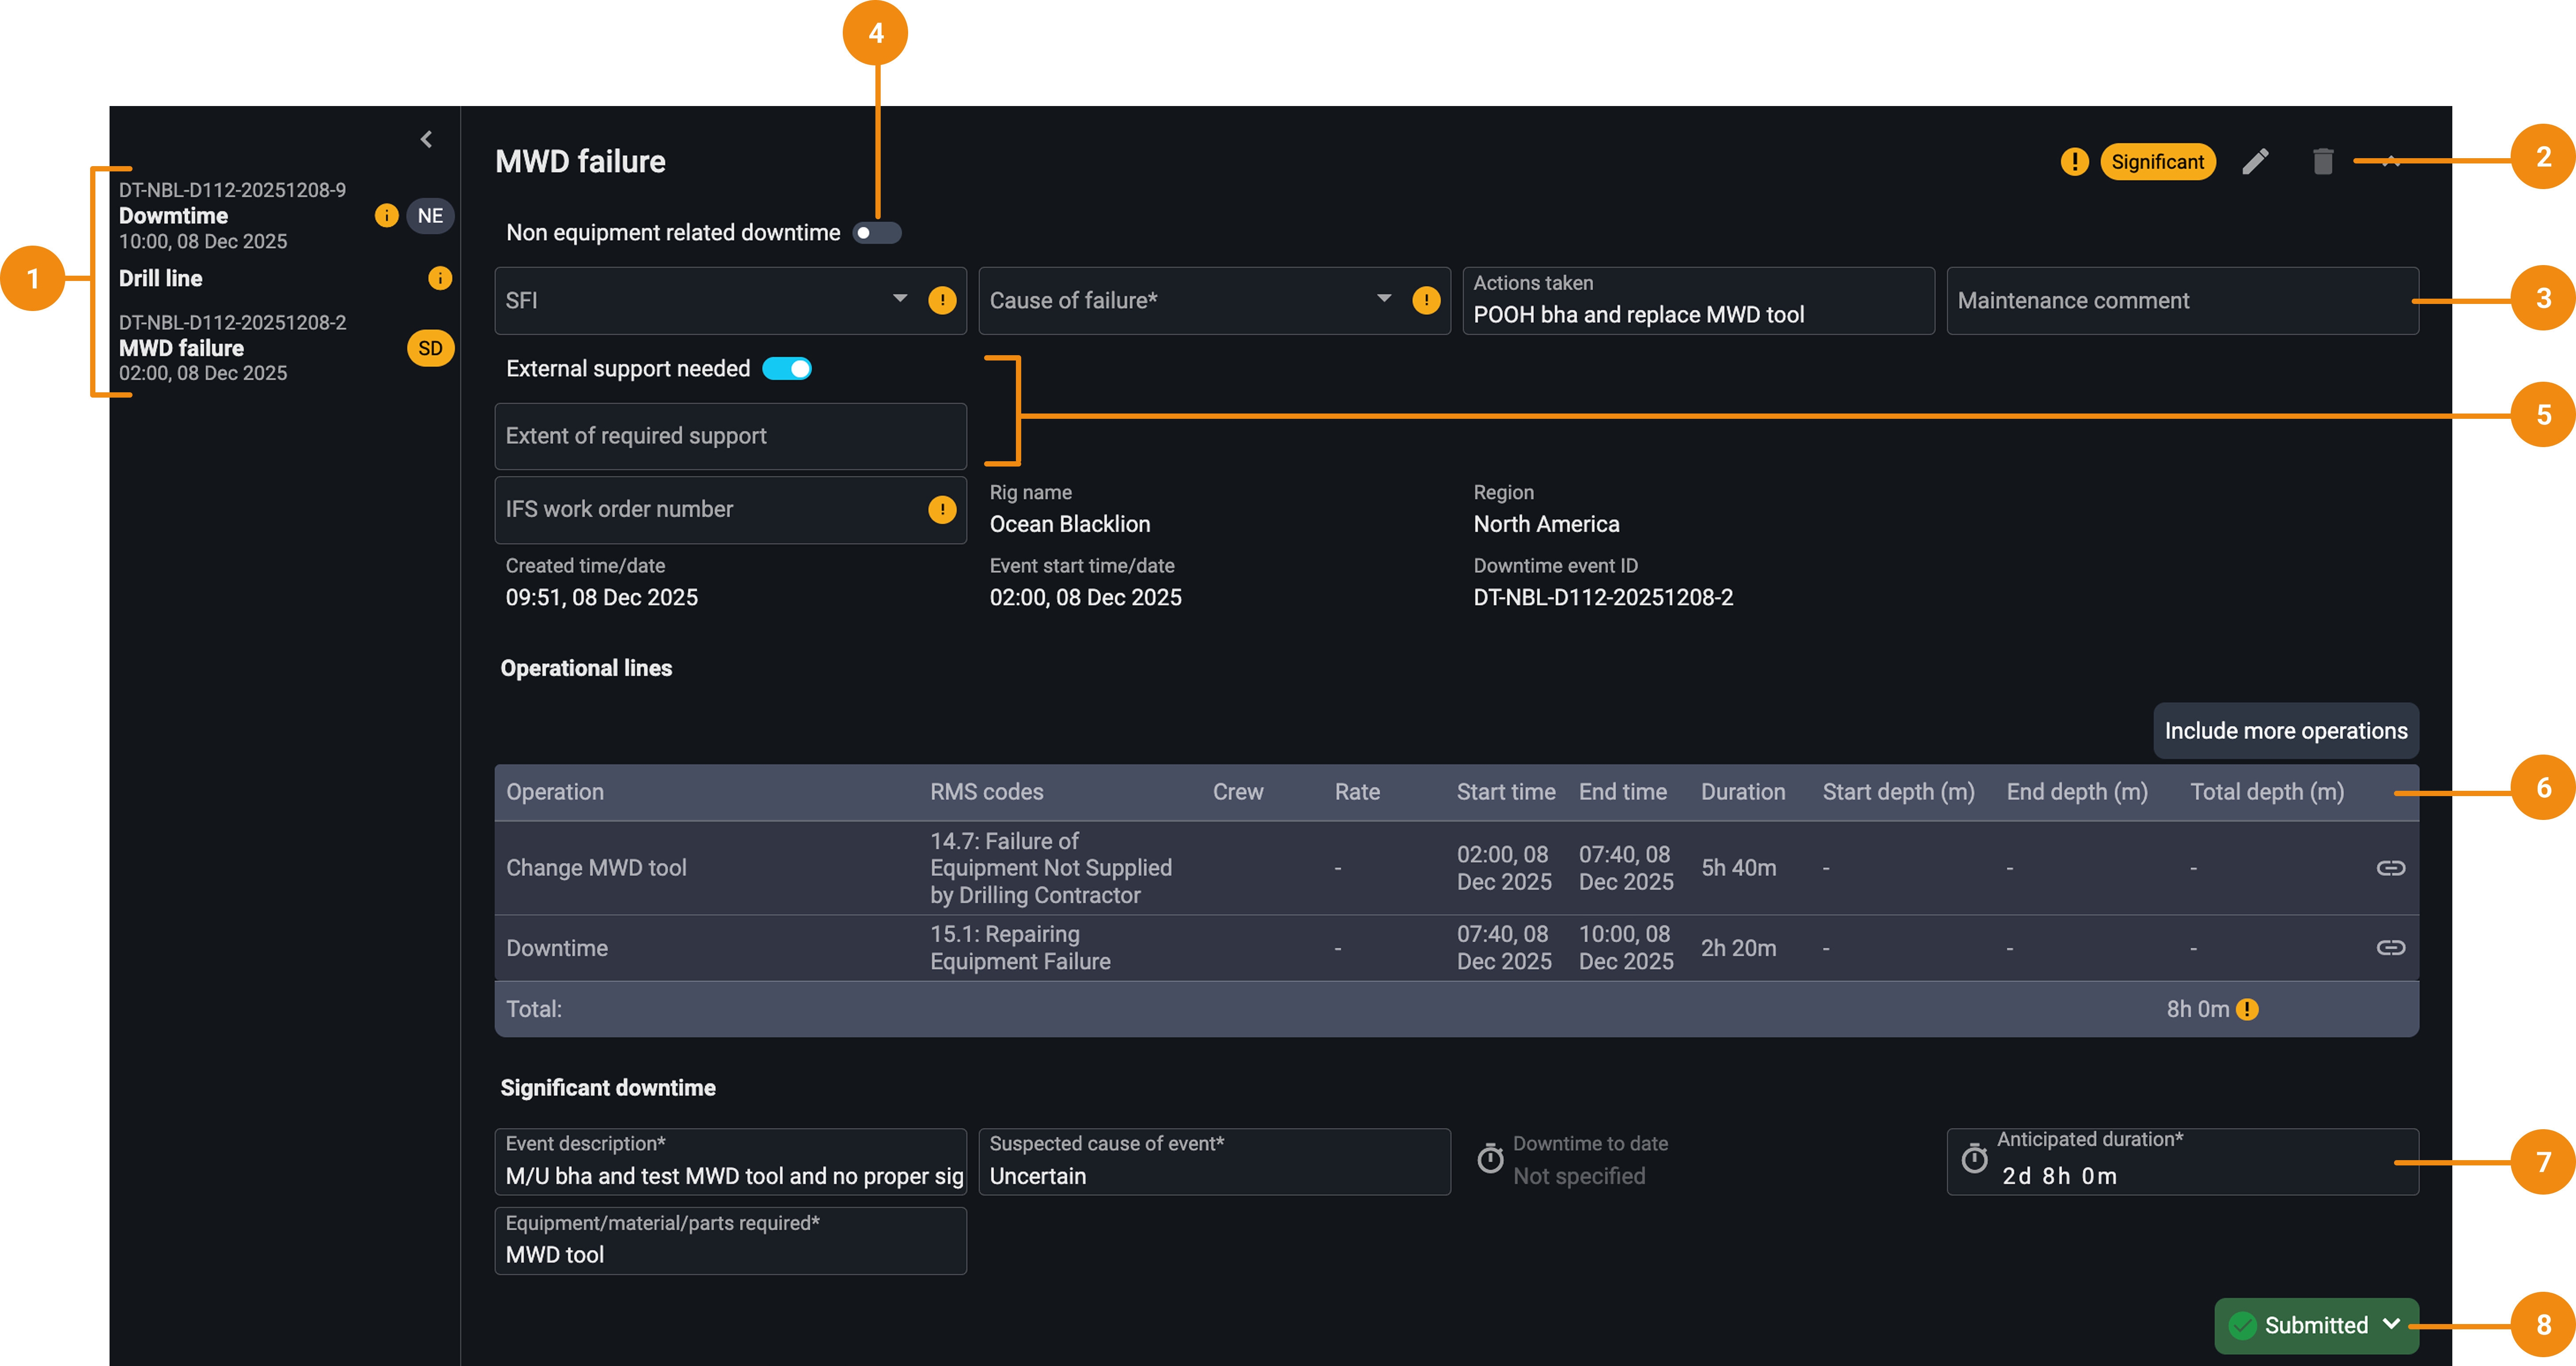
Sidebar event list: Located on the left, it shows a list of all downtime events for easy navigation between them.
Header: This section includes the event title, relevant tags for that event (Significant or non-equipment required), the
 edit icon to rename the event, and a
  delete icon is enabled only when the event has no linked operational lines.
Initial details section: This section contains fields used to categorize and document the root issue. Warming signs indicate the mandatory fields that must be completed.
Non equipment related toggle: Simplifies the form by removing technical fields such as SFI codes and IFS workorder number when turned on.
External support needed toggle: It enables a comment box where users can describe support from third parties (e.g., waiting on spare parts or specialists).
Operational lines section: This section shows all operational lines currently linked to the downtime event. These lines determine the event start time and automatically populate the associated well. Once at least one line is linked, a unique Downtime Event ID is generated.
Significant sowntime section: Becomes visible when the total linked downtime reaches or exceeds 6 hours. Includes additional fields that must be completed to enable submission.
Submit button: Appears and becomes active only when the event is marked “Significant” (6+ hours), and all mandatory fields are completed. Once the event is submitted, the button allows for resubmissions and provides timestamps for all past submissions.
Step-by-step instructions
Creating a Downtime event
Navigate to the RigPulse dashboard: Select a rig, navigate to its RigPulse dashboard, and locate the Downtime events section on the right.
Click the
Create button: Navigate to Downtime events on the dashboard and click on the Create button to open the event creation modal.Enter event title: Add a descriptive title for the downtime event (e.g., “MVD Failure”).
(If applicable) Mark as non equipment related downtime: If the downtime is not related to equipment, toggle this on. It simplifies the form by removing SFI codes and IFS workorder number fields.
Choose an SFI code: Click on the code selector to open a detailed dropdown. Navigate through up to 8 hierarchical levels (e.g., Rig General > Quality Control > Inclination) to select the right code, and click select to confirm. You can use the search bar to quickly locate the correct code.
Select Cause of failure: Use the dropdown to pick from predefined causes.
Fill in additional fields: Click on the rest of the free-text fields to add information about Actions taken and Maintenance comments.
Add IFS work order number: Copy and paste the number from the IFS system.
Tip
The number must start with 3 and be 9 digits long.
(If applicable) Toggle External support needed: Switch on if help is needed from outside parties. Enter a free-text comment describing the support (e.g., “Waiting for hydraulic specialist”).
Auto-filled fields: Some fields auto-populate with predefined information based on the system or on the linked operational lines.
Linking operational lines
Click "Link operational lines": In the Operational lines section of the Downtime, click the Link operational lines button to open a selector modal.
Select a date: When clicked, it opens a modal to first select a date. Once selected, it displays all operational lines from that day that are available to be linked. Only operational lines with a class code marked as planned or unplanned downtime will appear.
Choose the line(s) to link: Check the box next to the operational lines you want to link. Once linked, the Downtime Event ID is generated, and information on the start date and associated well will populate automatically based on the operational line’s details.
Important
If a line has already been linked to another event, it won't appear as an option again. Each operational line can only be linked once.
Submitting significant downtime events
Watch for the Significant tag: If the total downtime duration reaches or exceeds 6 hours, a yellow “Significant” label appears on the event.
Fill in additional required fields: Click on the Significant downtime fields to add the required information.
Click Submit: After filling out the mandatory fields, the Submit button becomes active. Clicking it sends the report to a predefined list of recipients.
Re-submit if needed: Open the dropdown on the Submitted button and click "Submit again" to send revised details. The system shows timestamps of the latest submission.
Editing and deleting Downtime events
Click the Edit button: Located at the top-right of each event card. Allows you to update the title.
Click the delete button: You can only delete an event if no operational lines are linked. If linked, the delete button will be greyed out. Unlink all operational lines using checkboxes (if available) to delete the event.
Downloading events
From the Downtime events dashboard
Open the
 more menu: Locate the downtime event you want to download in the dashboard, then click the more menu at the end of its row.
Click download: Click the download option from the menu. The selected event will be downloaded as a PDF file.
From the Downtime
Access the Downtime: From the Downtime vents dashboard, click the
Open button to view all events in the current month.Click the download icon: In the top-right corner of the module, click the
 Download icon to open the download panel.
Select the event(s) to download: Use the checkboxes to select individual or multiple events. You can also click the Select all checkbox to include every event in the list.
Download the PDF: Click Download to generate a PDF file. If multiple events are selected, each event will appear on a separate page within a single multi-page PDF.
Examples
A driller notices that a piece of equipment is malfunctioning, they record the event in RigFlow, and import the operations from RigFlow. Then they go to the Downtime, create a new event, fill in the details, and submit it if it qualifies as significant.
Tips and tricks
Quick search for the SFI code: Use the search function within the SFI selector to quickly find the right code.
Cannot submit a downtime event: Only significant events (6+ hours) can be submitted.
Unable to delete a downtime event: Downtime events can only be deleted if no operational lines are linked.
No Operational lines to link: If no operational lines appear when trying to link, it usually means all lines for the selected day have already been linked to other downtime events; each line can only be linked once. First, check the Daily drilling report for the chosen date to confirm whether any lines remain unlinked. Also, make sure that at least one operational line exists for that day with a class code set to “Planned Downtime” or “Unplanned Downtime”; only these lines are eligible for linking. You can tell if a line has already been linked by the icon indicators in the Daily drilling report:
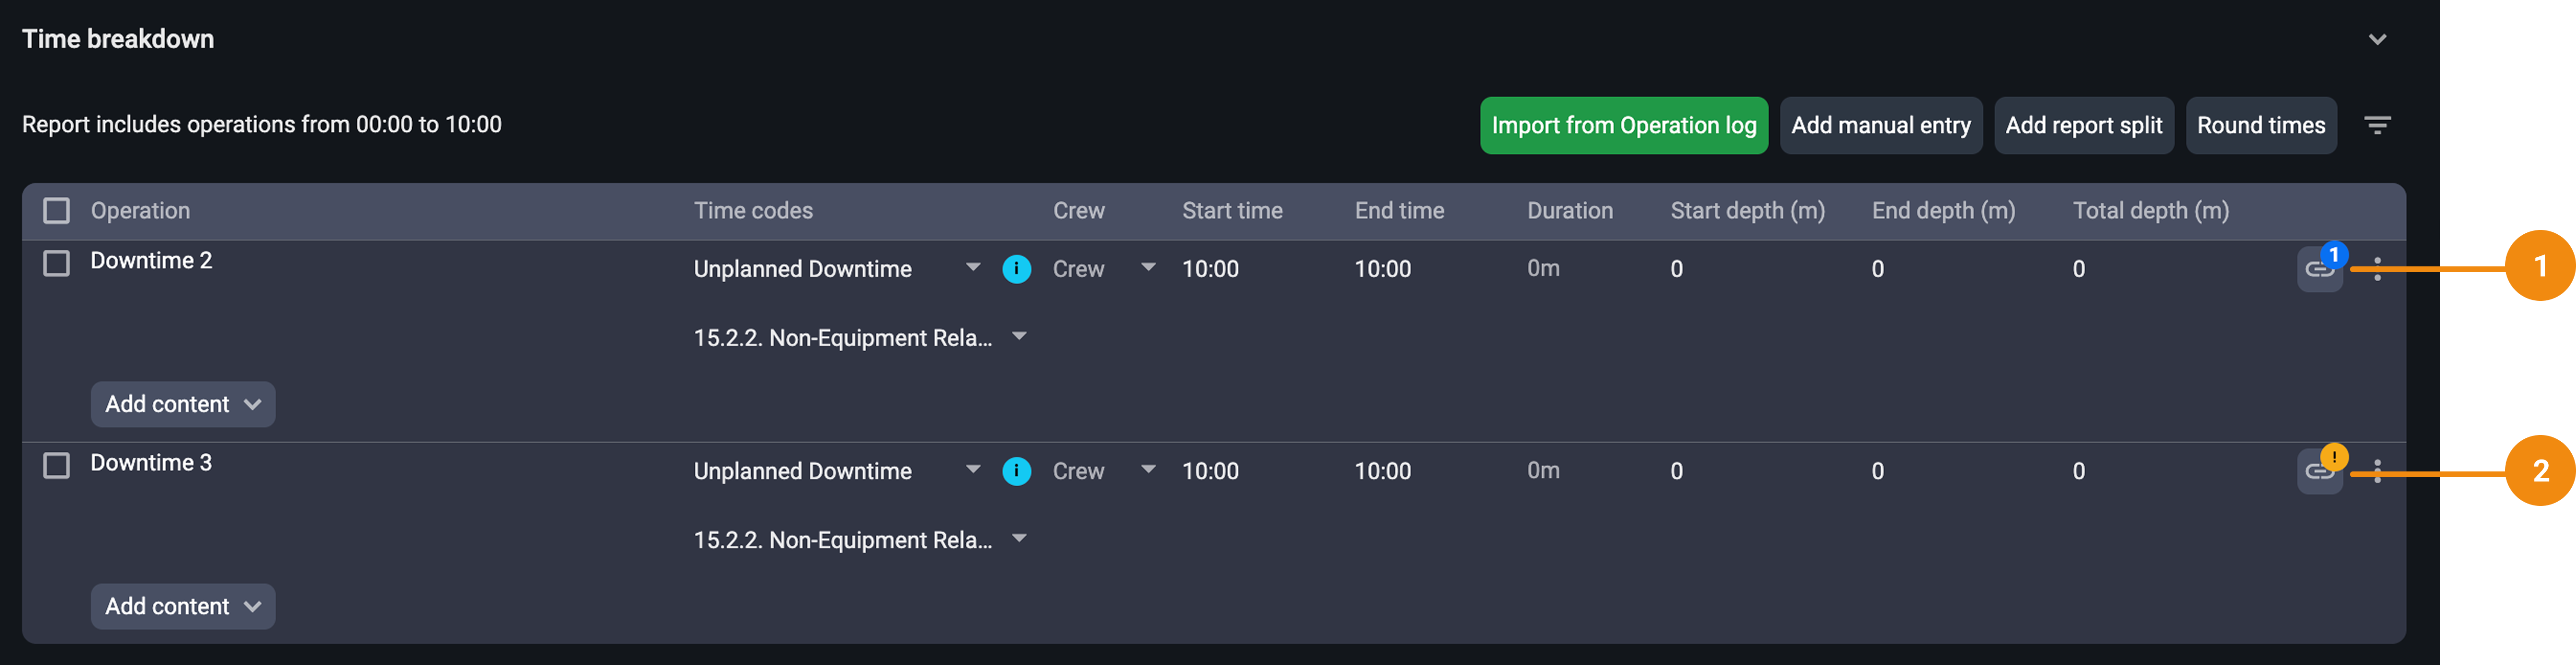
Linked downtime: A small number badge above the link icon, representing how many downtime events the line is currently linked to.
Unlinked downtime: displays a warning symbol above the link icon, indicating that this downtime line has not yet been linked.